Measure and know, guess and weigh
how cyclists conquer high peaks
Compare the performances of your old and new heroes
visually presented
Measure and know, guess and weigh
how cyclists conquer high peaks
Compare the performances of your old and new heroes
visually presented
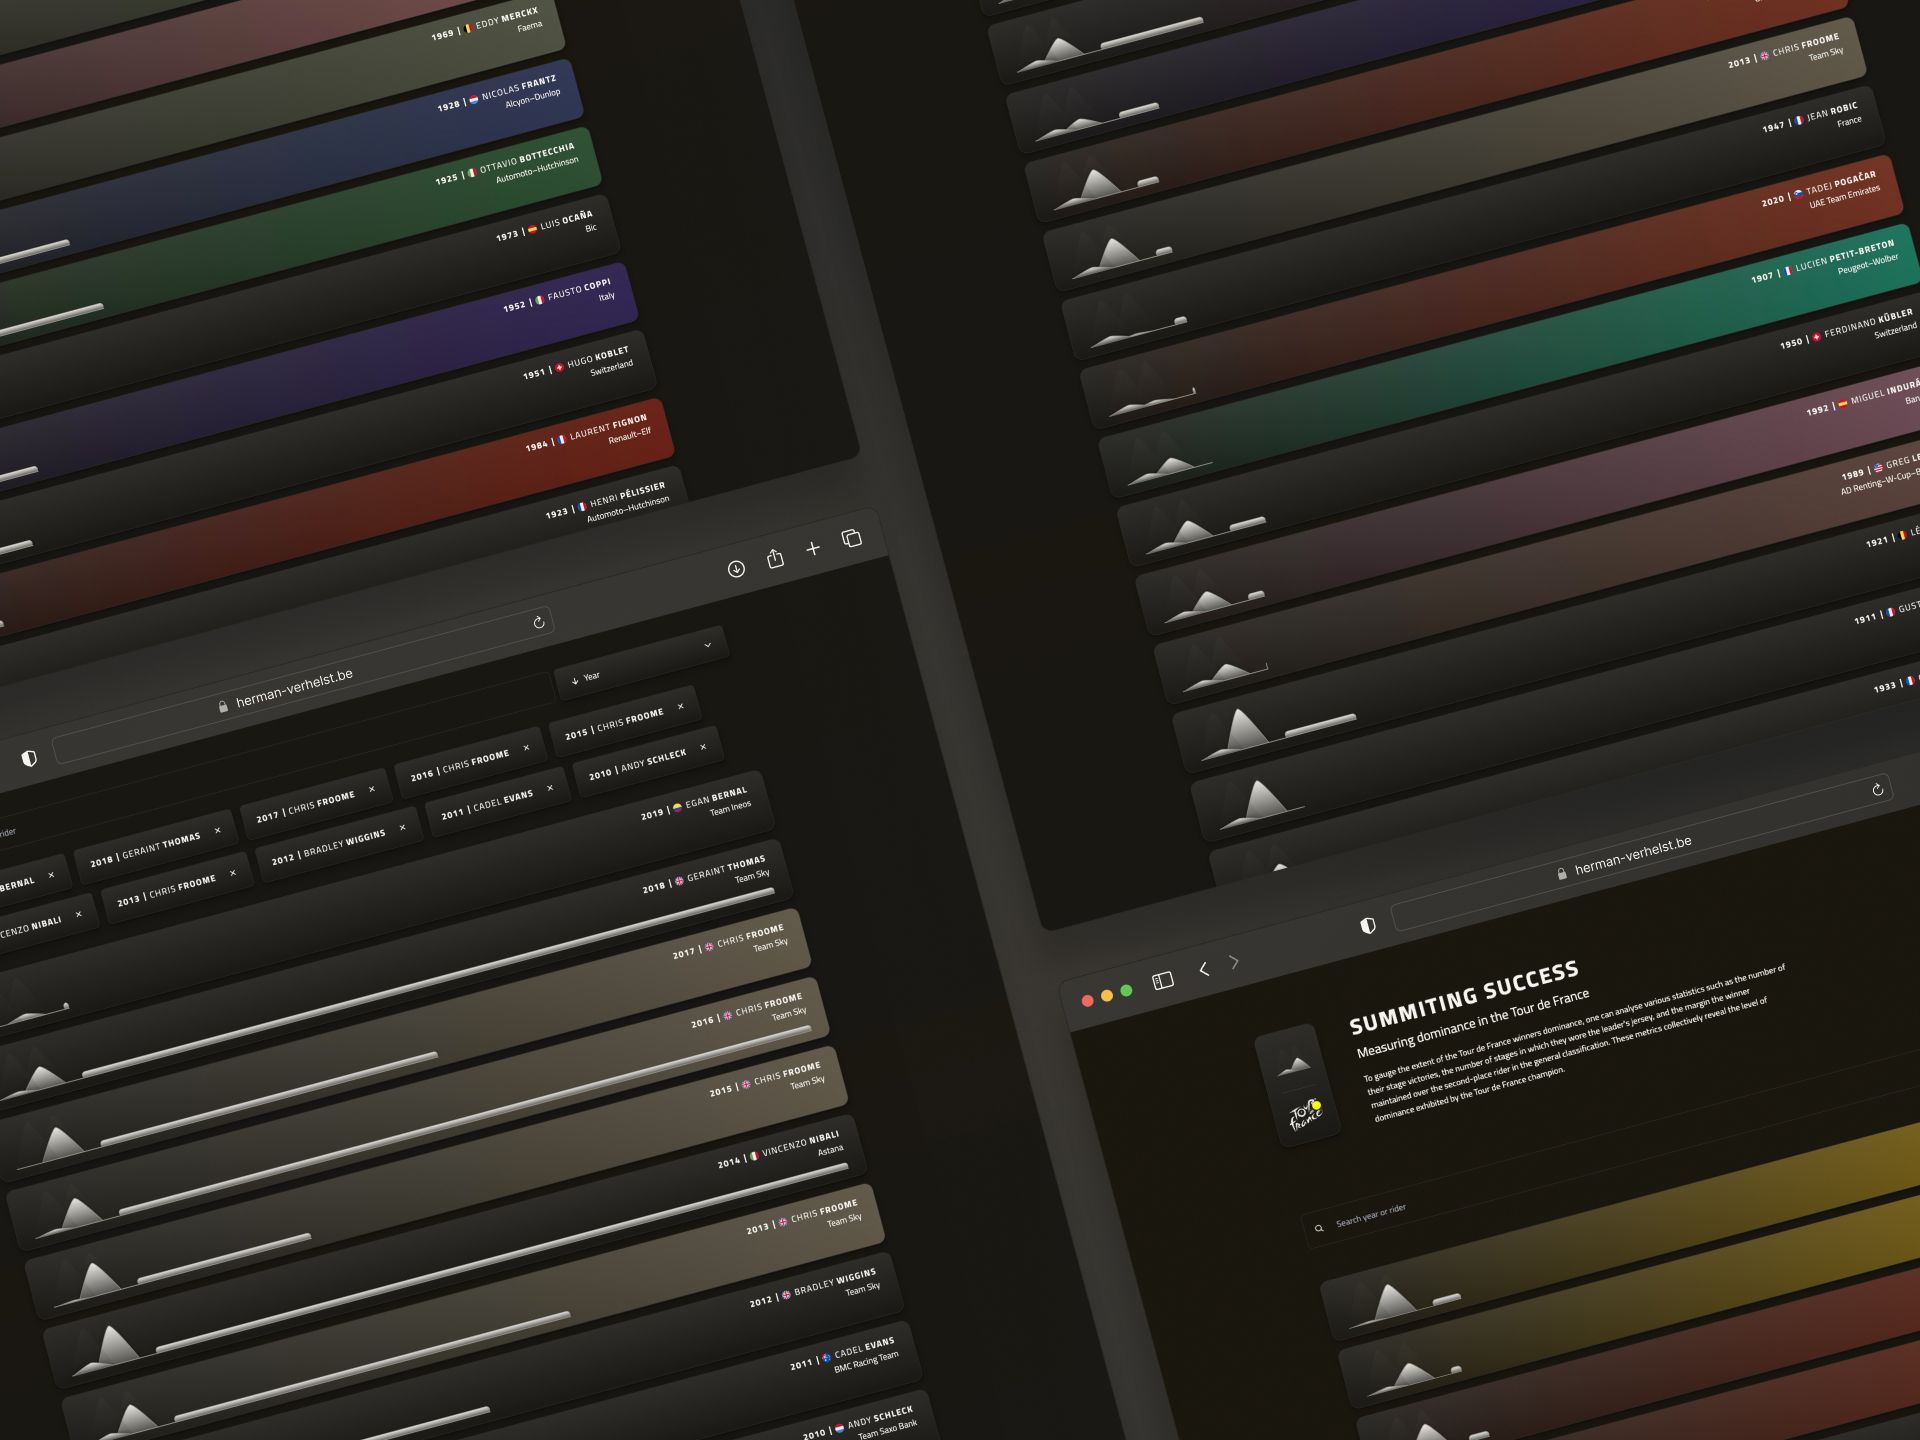
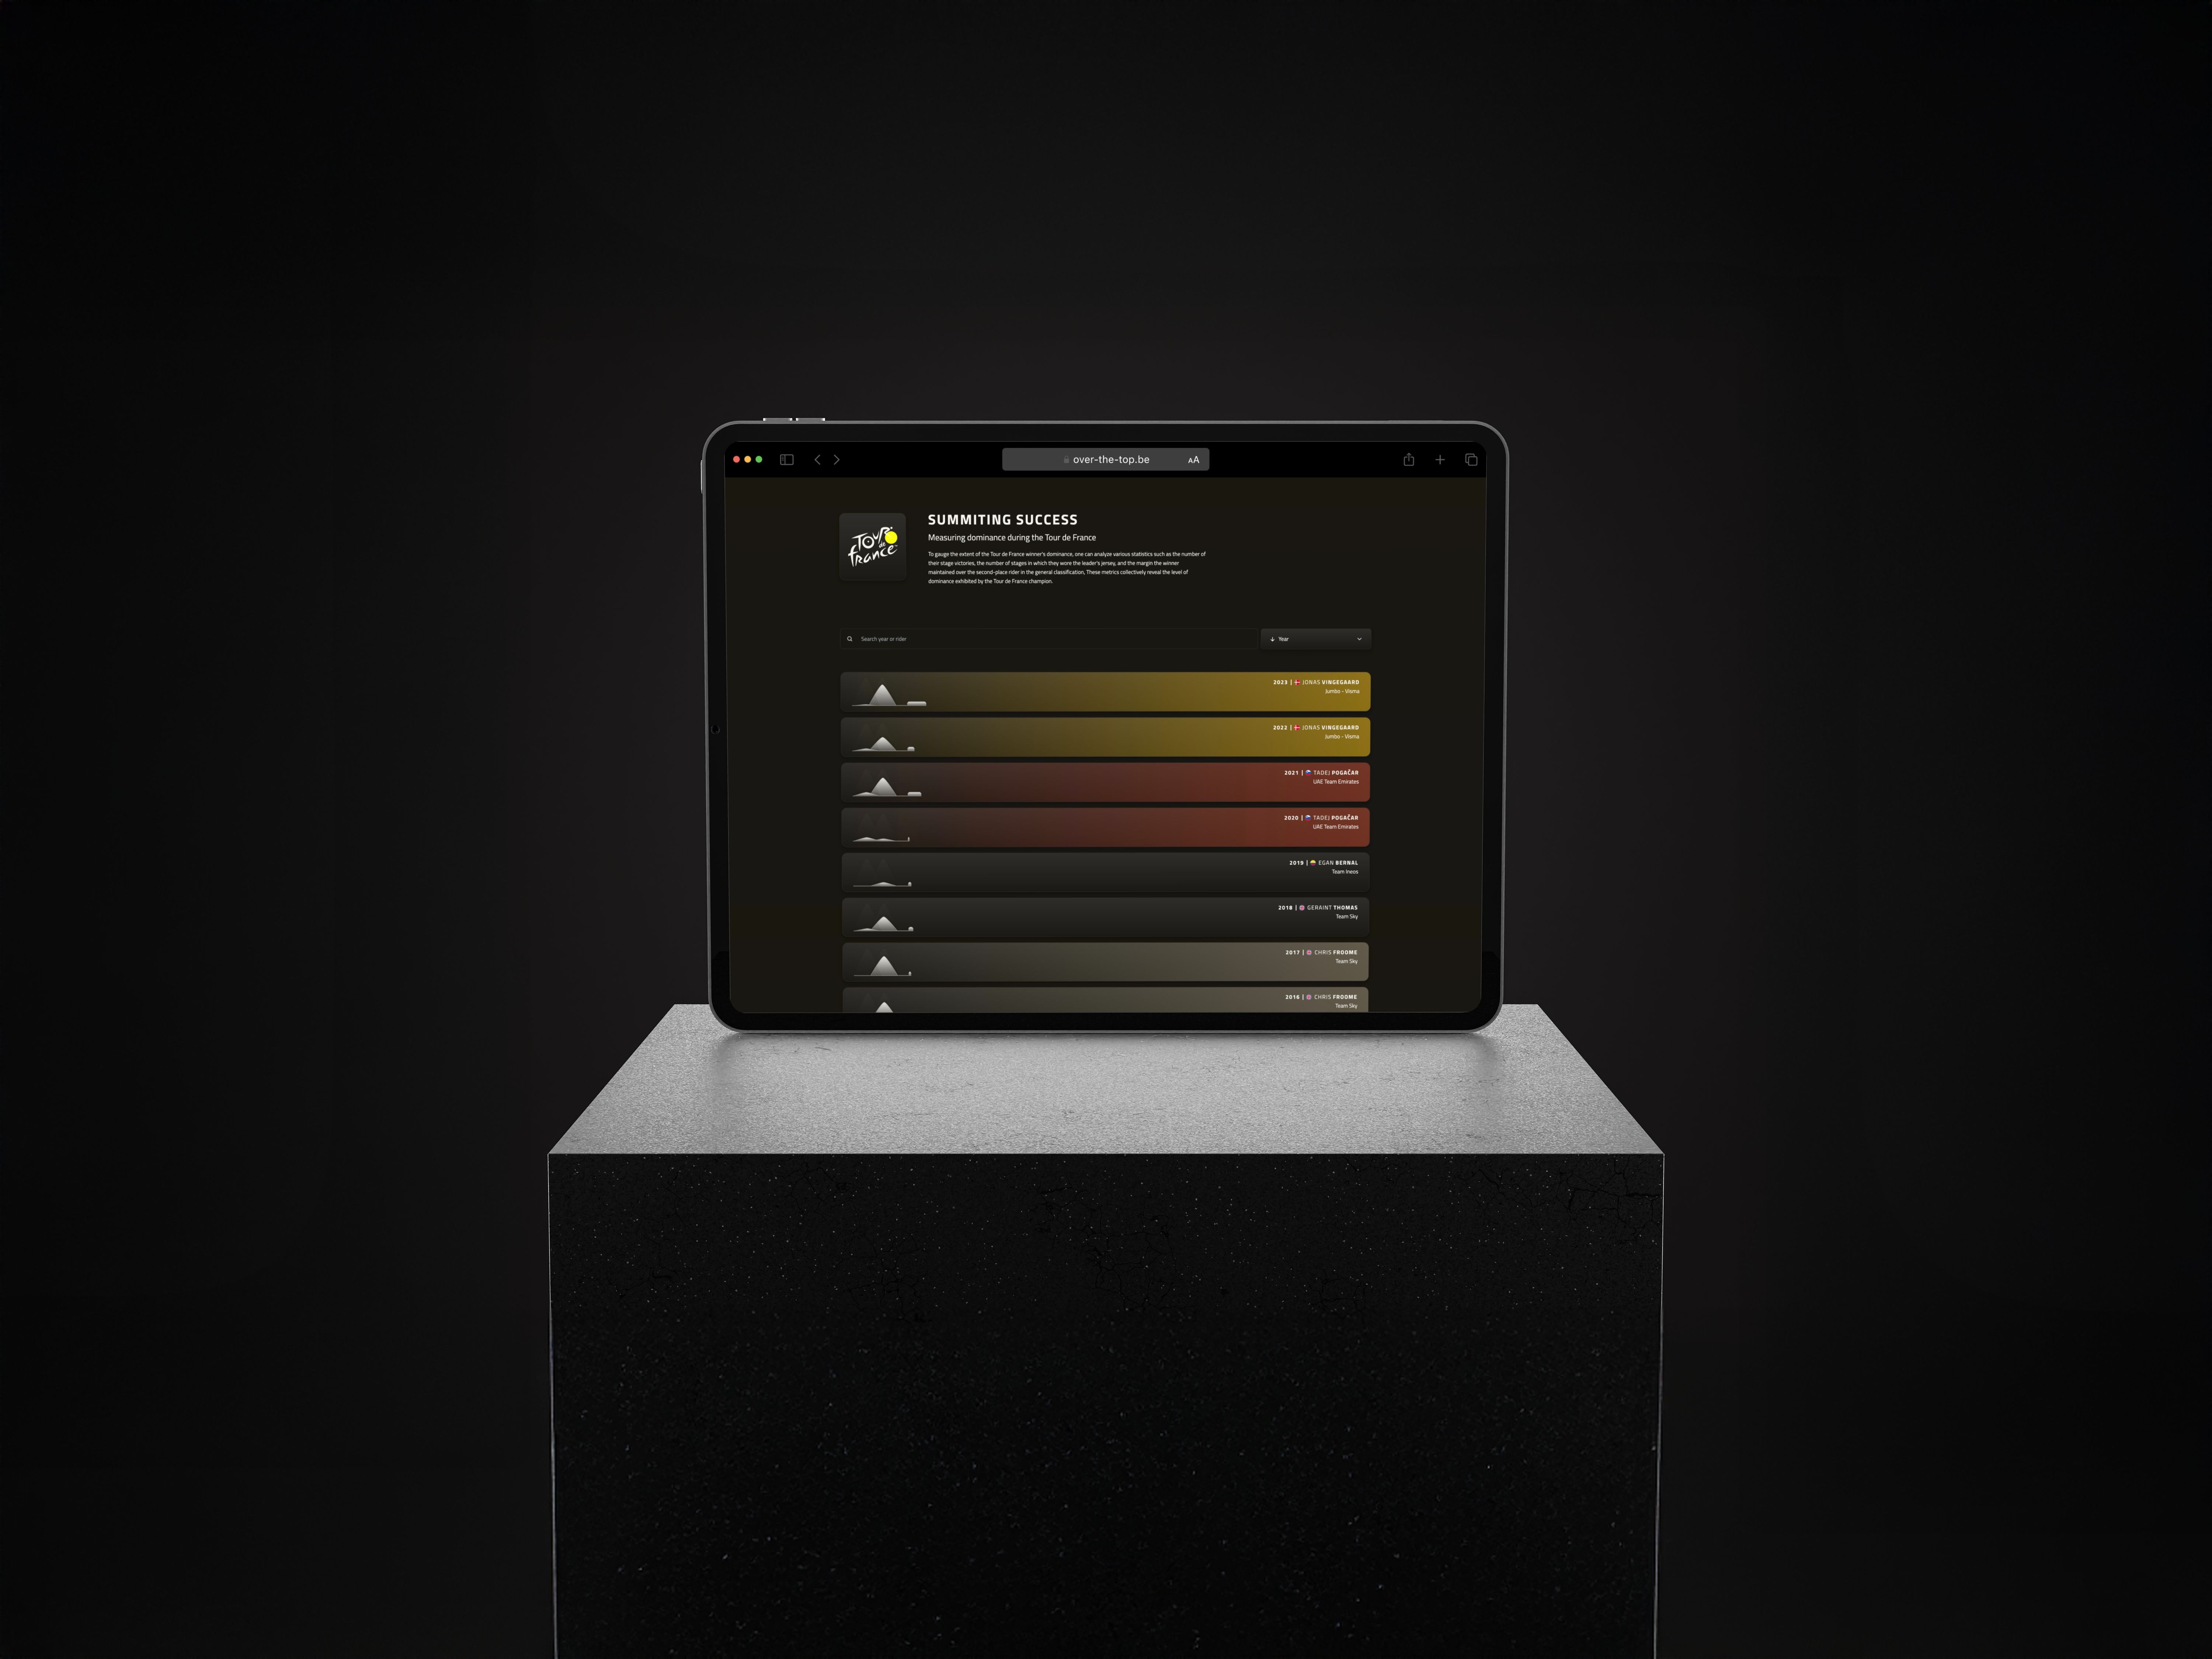
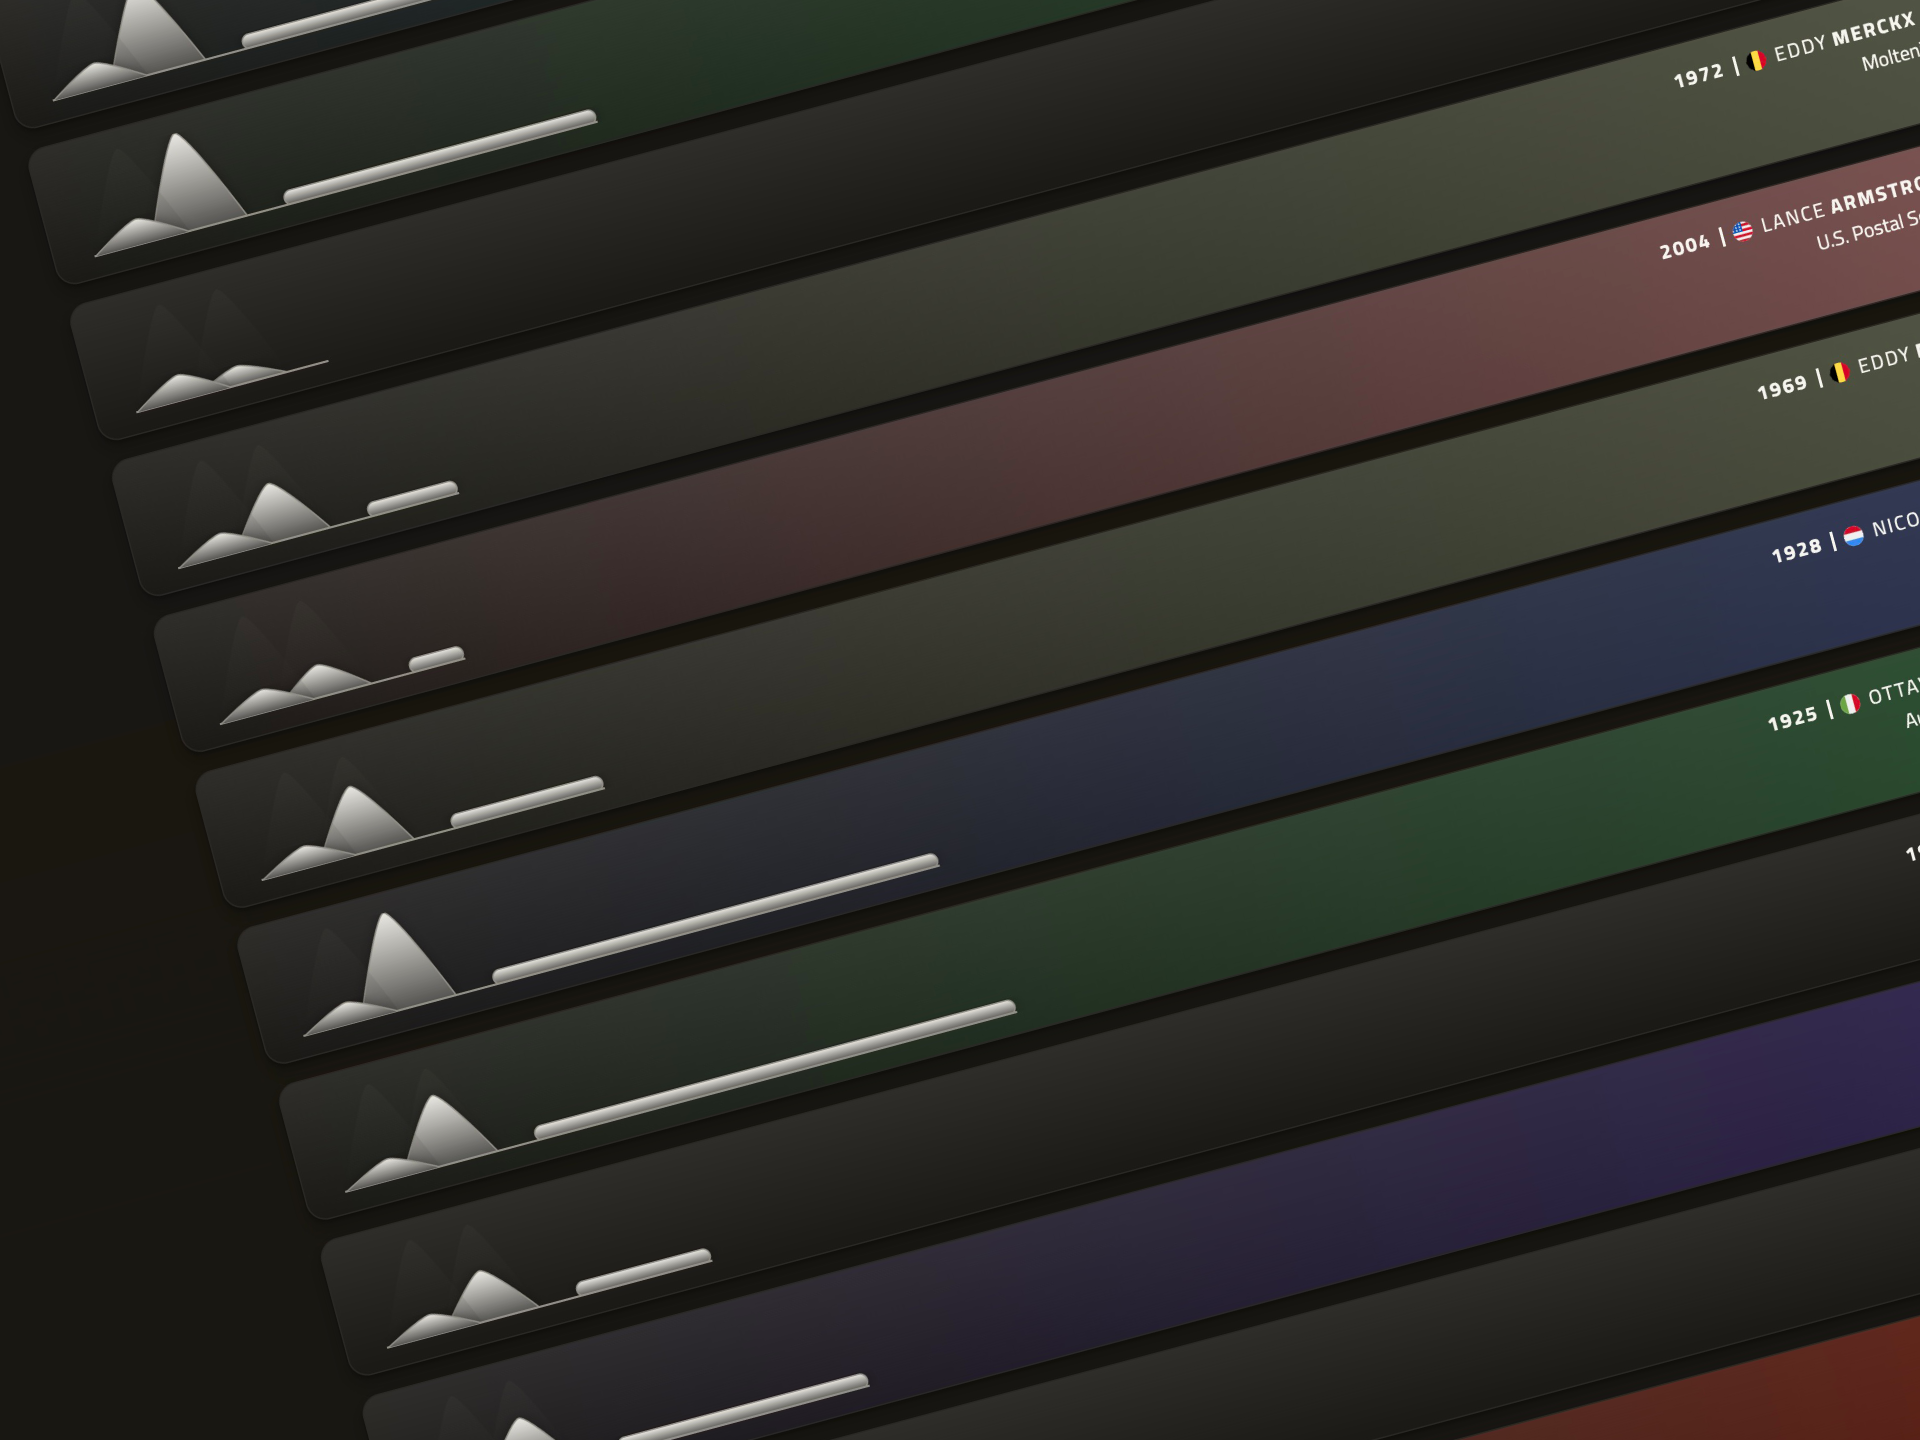
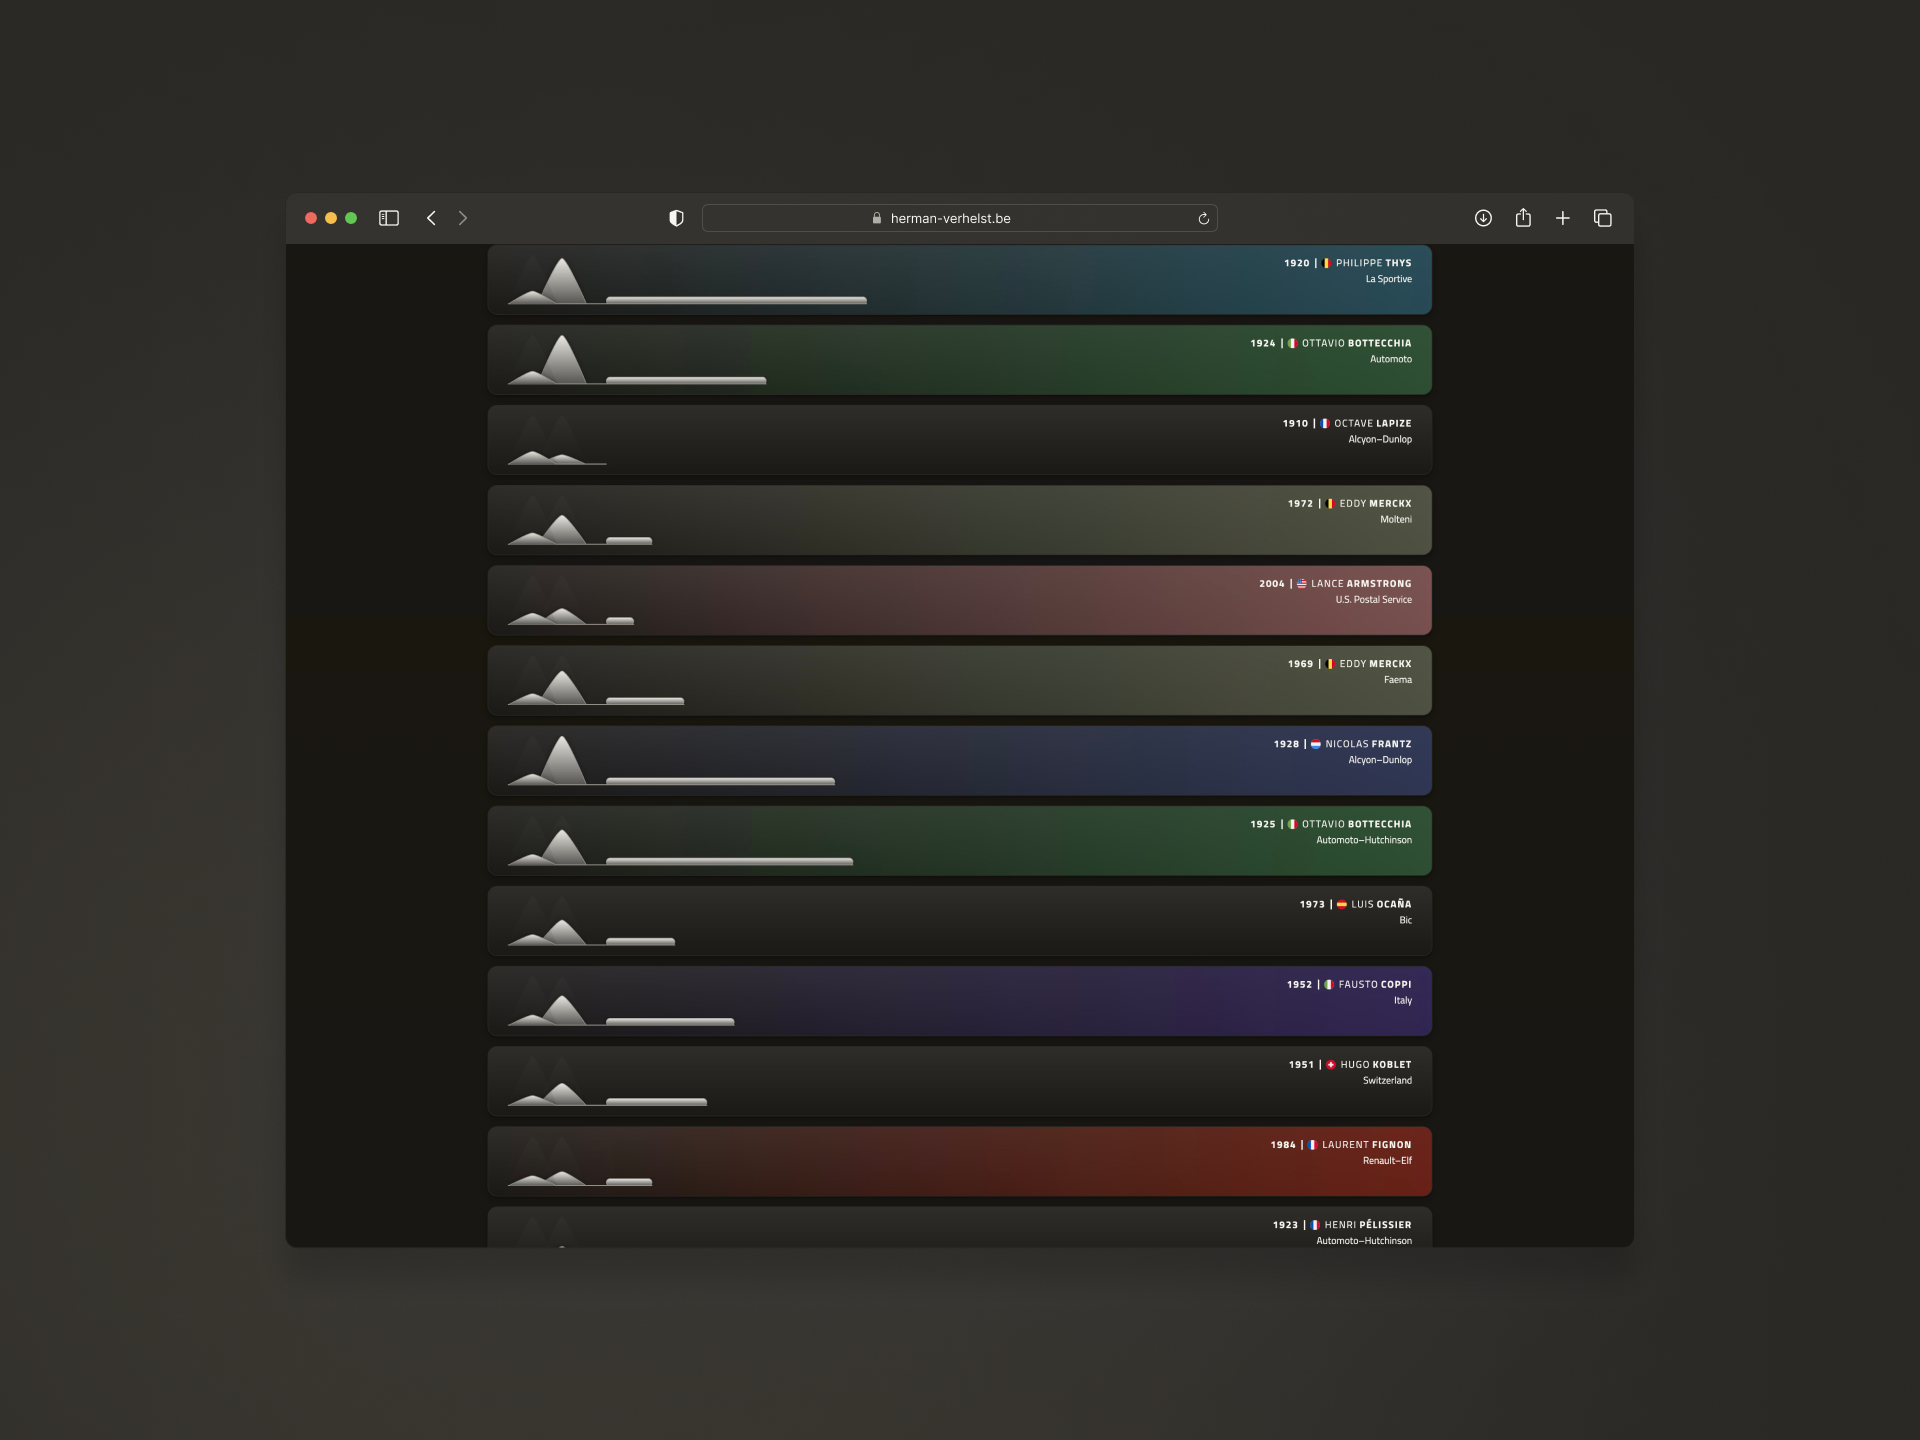
The Tour de France, a powerful cycling race, has captured the imagination of fans worldwide for over a century. For more than a hundred years, the best riders have pushed themselves to their limits for eternal glory. For more than a hundred years, there has always been someone who is the very best. But can comparisons really be made between all these editions and riders? This question intrigued me as a cycling enthusiast, so I started digging into data and records: stage winners, number of days in the leader's jersey, or the margin by which the lead rider outpaced the runner-up. Using D3.js, I developed this data visualization. It enables cycling fans to compare editions and winners. Colors, shapes, and numbers, each element tells its own story, bringing more clarity to this epic race.

Bewegend water in beeld
Water in werking